What technical analysis is — and is not
Technical analysis studies what price has already done in order to frame what might happen next. It does not forecast. Its practical value is structural: it gives a trader consistent reference points for entries, exits and invalidation, so decisions can be compared across time instead of being reinvented on every chart.
Reading the candlestick
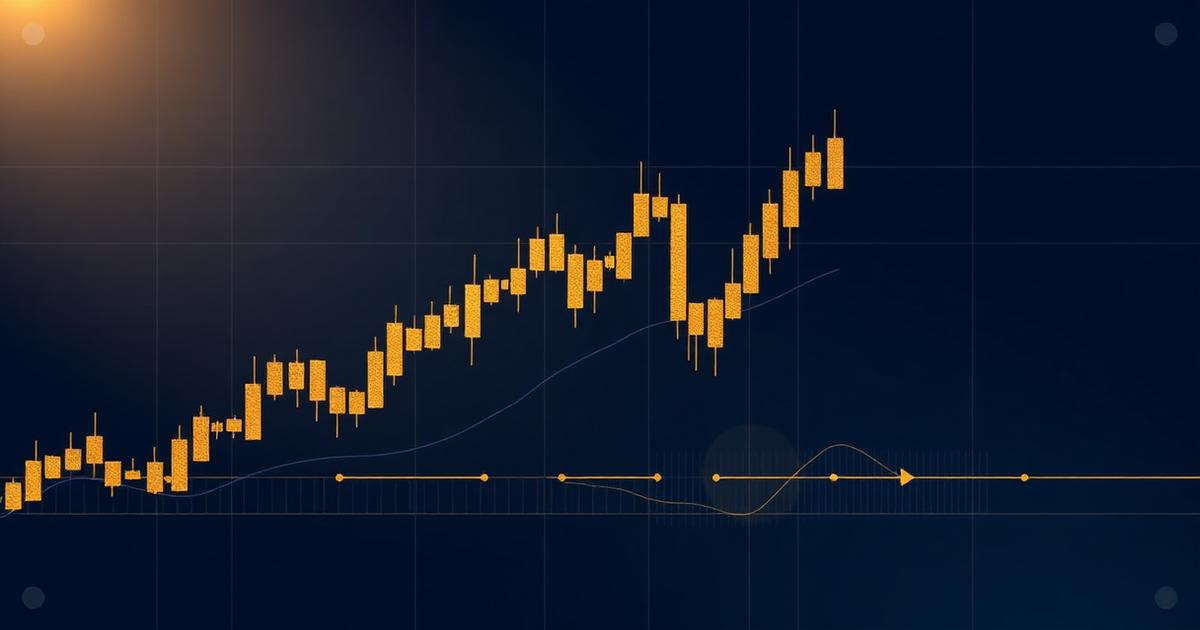
Each candle summarises four values over a period: open, high, low and close. The body shows the distance between open and close; the wicks show the extremes rejected within the period. A long upper wick means buyers pushed higher and were pushed back — useful information about who lost control, not a signal in isolation.
Timeframe discipline
The same market looks bullish on one timeframe and bearish on another. Choose a primary timeframe for decisions and one higher timeframe for context, then stop looking. Switching timeframes after entry to find a chart that agrees with an open position is one of the most common self-inflicted errors, discussed further in trading psychology.
Support, resistance and market structure
Support and resistance are zones where prior activity clustered, not precise lines. Their usefulness comes from the fact that many participants are watching similar areas. Market structure — the sequence of higher highs and higher lows, or the reverse — is the simplest description of trend and often the only one a trader needs.
- Higher highs and higher lows — an uptrend structure.
- Lower highs and lower lows — a downtrend structure.
- Overlapping swings — a range; trend tools tend to misfire here.
- Break of structure — the first evidence a regime may be changing, not confirmation.
Indicators: derived, lagging, and easily overused
| Family | Measures | Weakness |
|---|---|---|
| Moving averages | Smoothed direction | Lags turns; whipsaws in ranges |
| Oscillators (RSI, stochastics) | Momentum extremes | Stay "extreme" through strong trends |
| Volatility bands | Dispersion around a mean | Reactive, not predictive |
| Volume tools | Participation | Fragmented and unreliable in some markets |
Every indicator is a transformation of price. Stacking five of them does not add five sources of information — it usually adds one signal with five delays. Two complementary tools plus clean price structure is a common practical maximum.
An indicator cannot tell you how much to risk. That single limitation explains why analysis alone never made anyone consistent.
Turning analysis into a decision
- Establish context on the higher timeframe: trending or ranging.
- Mark the two or three levels that genuinely matter.
- Define the price that would prove the idea wrong.
- Derive position size from that distance — see risk management in trading.
- Write the plan down before acting on it.
Educational disclaimer: this article is published for informational and educational purposes only. It is not financial, investment or trading advice, and it does not represent official information about gmTrade.ai. Trading involves substantial risk, including the loss of capital.
Written and reviewed by
Financial Markets Research Team
Our editorial group researches market structure, platform mechanics and trading education. We publish independent explanatory material and do not provide financial advice or brokerage services. Last reviewed 2026-08-06. Editorial policy · Methodology